Calculating the Useless Content Ratio (UCR)
 |
August 19, 2022
|
August 19, 2022
The Useless Content Ratio
This post is long long overdue… I’ve been using and talking about he Useless Content Ratio for years. Google’s upcoming “helpful content” algo update is forcing my hand, because it looks much like the Panda update from the past, during which we made extensive use of the Useless Content Ratio.
The UCR is very simple: the ratio of pages on a website that have generated traffic during a specific time period. It’s application is twofold. First, to determine in aggregate, how Google views the overall content quality of a site, simply put, if lots of pages aren’t generating traffic, it indicates that the site either lacks the authority to support the volume of pages it has and/or that the content is overwhelmingly garbage. In the case of Panda (and the upcoming Helpful Content update) which both have sitewide implications, a preponderance of pages that don’t generate traffic indicates that these algo changes will negatively impact the good content that exists on the otherwise bloated site. The second application of the UCR is to guide firms into how much they should be investing in additional content. Put simply, if 90% of pages have generated traffic during the past 6 months, then fire up the keyboard, because those new posts are likely to generate traffic. Conversely, if only 10% of a site’s pages have generated traffic during the past 6 months, why on earth would anyone continue to barf out vapid blog posts that no one is going to see? This is typically done in search of the elusive long tail searches. What many don’t grok is that without the authority to support a huge pagecount, these long tail pages will never surface in search results.
UCR is a Blunt Instrument
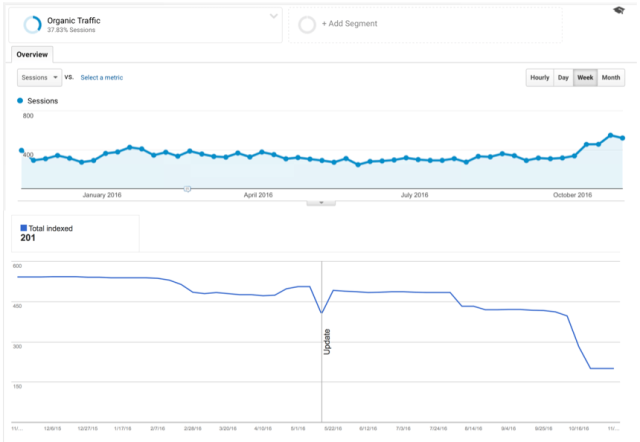
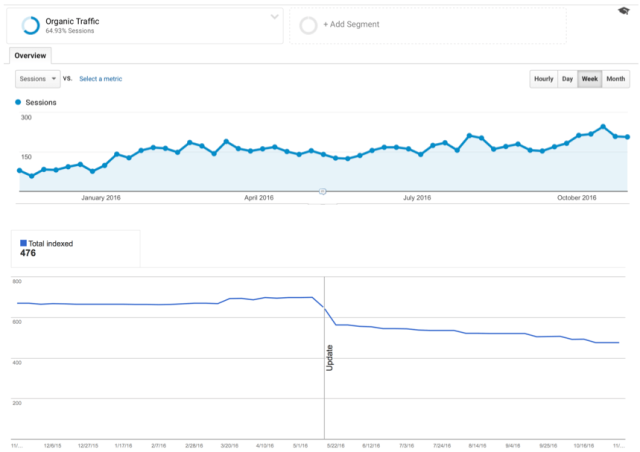
Now – its very important to note that UCR does NOT provide a page level analysis – we are looking at the site overall. So a high UCR doesn’t mean you shouldn’t publish that key piece of content for which you want to be hired. Instead, it’s an overall indication of how Google views the quality of content on your site vis-a-vis the site’s overall backlink authority. It not only provides us with guidance as to the aggressiveness of ongoing content development efforts, but also reveals those sites who may be solid candidates for content pruning – the process of going through content page by page and determining if that content should be kept, killed or consolidated. The subsequent reduction in pagecount actually results in greater traffic and more conversions (leads) which turn into consultations because ideally you are keeping the business-relevant content and jettisoning the irrelevant useless content. I’ve written Case Studies extensively on this for Search Engine Land back in 2017: More Content Less Traffic Part 1 and More Content Less Traffic Part 2. Here are two graphs from those articles that showcase how a reduction in pagecount correlates with an increase in traffic:
Calculating the UCR
Calculating the UCR is very simple. First, the denominator is the number of pages on your site. You can use a simple “site:example.com” to find an index count; however, I find that number to be very inconsistent. Instead, you are better off utilizing page count data out of Google Search Console. I wouldn’t recommend using your sitemap for this, b/c in many cases sitemaps contain errors, or more frequently omissions either deliberate or unintentional. Next you need to calculate the numerator of the fraction… this is done (relatively) simply straight out of Google Analytics through the Landing Pages report.
- Select a reasonablly long timeframe. The lower your overall traffic volume, the longer this timeframe should be. At a minimum look at 3 months of traffic if your site generates >2.5K users/monthly. Below that volume, I’d probably look at 6 or even 9 months.
- Segment by Organic Traffic only
- Open the Landing Pages report under Behavior (don’t get misled by the other “Behavior” report which can be found under the Audience reports. Why Google has two different reports called Behavior is beyond me.)
- This will generate a list of landing pages (i.e. the first page someone saw on your site) from organic and local search queries over the specified timeframe.
- Scroll to the bottom right hand corner to get a total number of these landing pages.
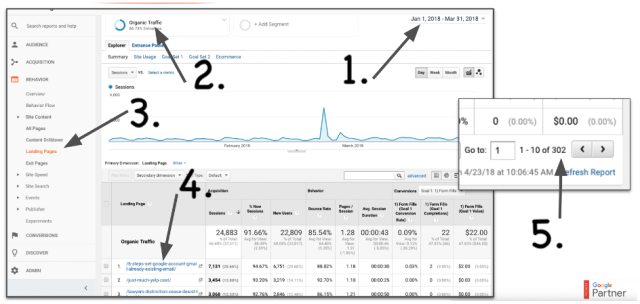
Now you now the percentage of your pages that drive traffic (or don’t). Use this to mathematically evaluate the priority of continued content posting or if you should consider a content reduction as part of your Content Strategy (which is more likely the case for firms who have been aggressively chasing the SEO golden goose for years.)